ChangeLab Research
The ChangeLab course, STAT 300: Data Analysis in the Real World, gives students the opportunity to work on a project provided by a client. In this course, students conduct a complete data analytics project including collecting, organizing, visualizing, and analyzing data. The students meet with the client during the semester. At the conclusion of the semester, the students present their final product to the client. This course is offered every semester. The topics will vary with each offering and the course may be repeated. Following are descriptions of previous STAT 300 projects:
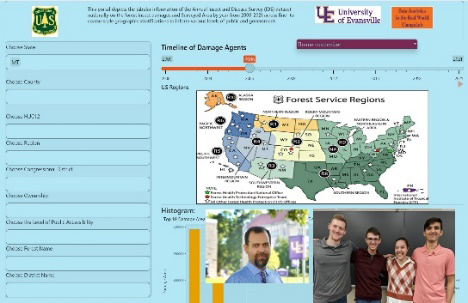
US Forest Service Project
The project was to take the Annual Insect and Disease Survey (IDS) dataset nationally (about 62 GB) and create a display portal that depicts tabular and spatial information on Forest insect damages and Surveyed Area by year from 2000-2021 across fine- to coarse-scale geographic stratifications to inform various levels of public and government (Congressional District, County, National Forest, State, Region, etc.). Also, the project extended by incorporating Wildland Fire area impact information into the display portal to augment the Annual Insect and Disease (IDS) survey dataset and provide for holistic disturbance ecology interpretations.
The project was awarded the Leader in Technology Award during the 28th annual Celebration of Leadership program by Leadership Everyone.
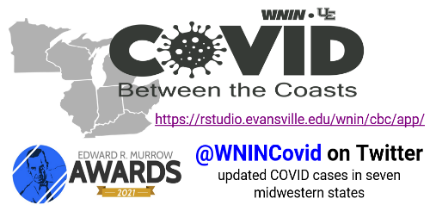
Covid between the Coasts Project
This was a collaborative project between two ChangeLabs at UE, WNIN, and ¿Qué Pasa, Midwest?. It culminated in an award-winning, investigative podcast series dedicated to telling the story of COVID-19 in the Midwest from the Midwestern perspective. One ChangeLab was Communications-focused while the other was in Data Science. The project won a National Murrow Award.
The Data Science ChangeLab work contained the initial analysis conducted that incorporated demographic information from the US Census Bureau and COVID-19 statistics to assess the impact of COVID-19 across the Midwest region and how it could be disproportionately affecting people based on several demographic characteristics. In addition, the group created an interactive website app that was consistently updated to allow the public to explore and see how COVID-19 spread across the Midwest. It also includes the ability to compare any two counties in the seven-state region. Lastly, a Twitter script was developed to tweet out the daily new case numbers for all seven states (Illinois, Indiana, Iowa, Ohio, Michigan, Minnesota, and Wisconsin).
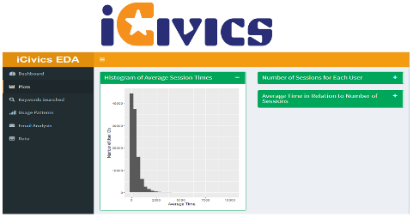
iCivics Project
This project was done for iCivics, Inc. which is a nonprofit organization in the United States that provides educational online games and lesson plans to promote civics education and encourage students to become active citizens. Mathematics students created an app to provide insight into the received data set with the following:
- Data visualization using the user’s selected plots
- Keyword search to filter the data
- Analyzing the usage patterns of their websites by users
- Analyzing the activities of users who are subscribed or unsubscribed to the email list
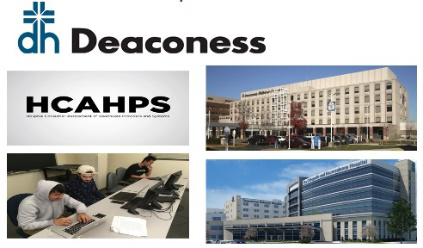
Deaconess Hospital Project
Students worked with Deaconess Health System, located in Evansville, Indiana. The project had two parts:
- Part one: Students analyzed mortality data for the hospital system.
- Part two: Students created an app for the patient quality survey data of the hospital.
UE Purple Post Project
This project was completed for the Student Retention Team at the University of Evansville. In the project, students found a model to flag college students who have a high probability of dropping out. It also resulted in a dashboard for the Retention Team to access the model's predictions.
UE Baseball and Volleyball
Using VolleyMetrics game statistics and data from the 2019, 2020, and 2021 Volleyball seasons, students provided analysis to support the team. They considered position analysis, game statistics analysis, and correlation analysis of the data, as well as visualization of the data and analyses.
Students also analyzed UE Baseball data from the team’s Trackman system. They generated dynamic tools for performing baseball sports analysis and creating dynamic plots based on user selections.

Office Phone
812-488-1234
Office Email
math@evansville.edu
Office Location
Room 314, Koch Center for Engineering and Science
